

Growth of India's Share Of Global GDP in 15 Years: From 2.5% To 3.3%
India's share of world GDP rose from 2.5% in 2010 to 3.3% in 2025 — the third-largest gain of any country, trailing only China and the United States. Mapped with Latlong's Aaloka analytics engine, here's how the world's economic hierarchy reshuffled over 15 years, and why India's climb is more impressive than the headline number suggests.
India's share of world Gross Domestic Product (GDP) increased from 2.5% in 2010 to 3.3% in 2025. In this 15-year period, this is the third largest gain by any country over that 15-year period. China and the United States are the only countries to increase their share by a larger margin during this period. Interestingly, these are the only 3 countries in the Top-10 to increase their share of global GDP. Despite 7 of the Top-10 economies losing share, the world's 10 largest economies now hold a bigger combined share of global GDP (66.6%) than they did in 2010 (64.5%).
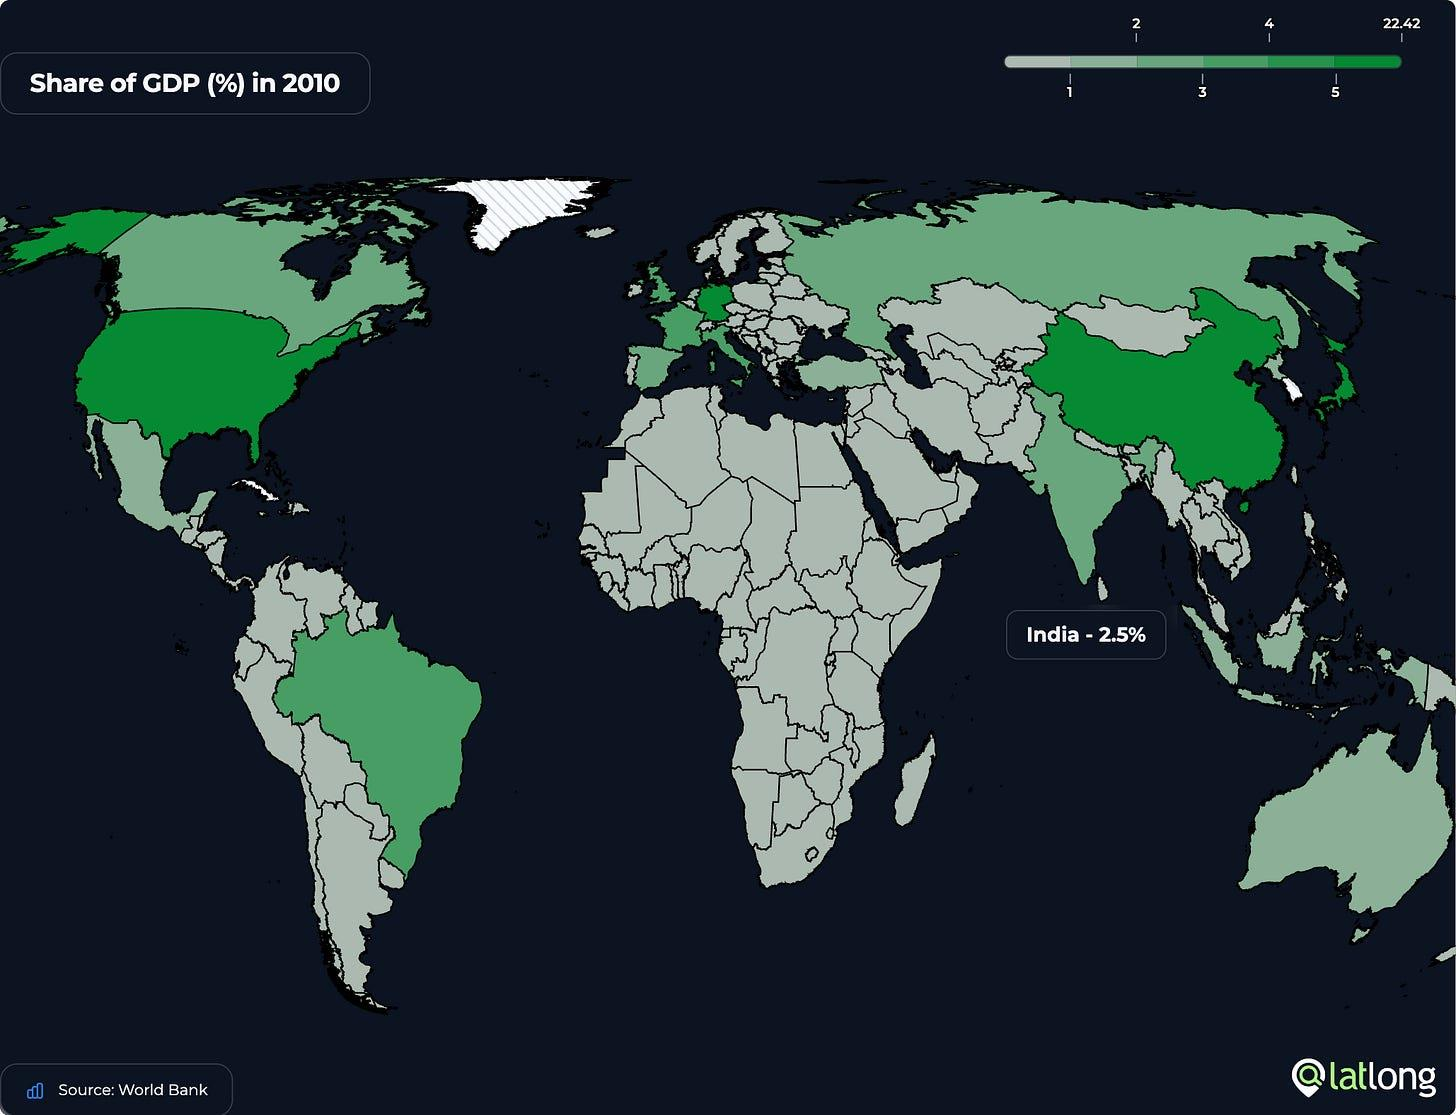
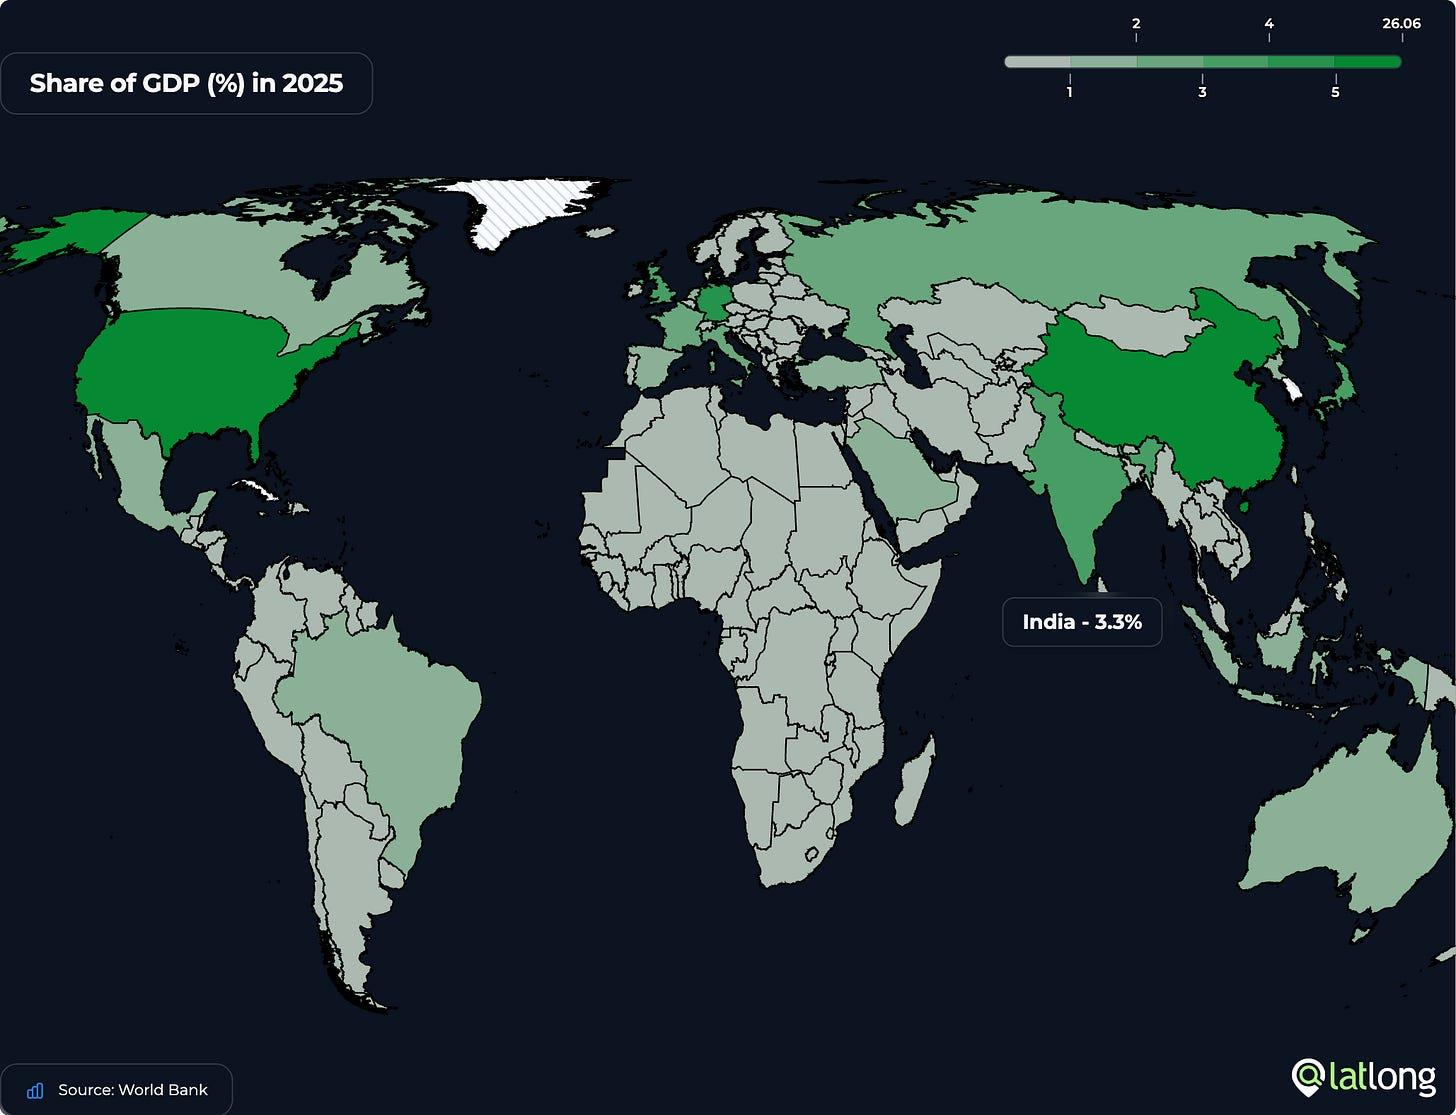
Maps were built using Latlong's Aaloka analytics engine. An Equal Earth projection is used for the world map rather than the more familiar Mercator one. Each country's size on the map reflects its true land area, not one inflated by latitude the way Mercator inflates countries like Canada, Russia or Greenland. (Data source: World Bank)
The story which emerges from the two maps is: India has grown fast enough to join a fairly small club that is itself pulling further away from everyone else. Colour of most of the countries in these maps doesn't quite change. South America's story is stark: Brazil, the one country with a stronger greenish tinge among South American economies in 2010, visibly fades by 2025 — its share fell from 3.29% to 1.93%, enough to drop out of the world's top-10. The region didn't stay still; it lost ground, even as the GDP share of the top-10 as a group rose over this 15-year period.
How The Top-10 Reshuffled
The infographic below tells the story at a glance: the US & China both gained big shares; India is the only other top-10 economy that grew, moving from 9th place in 2010 (2.50%) to 6th in 2025 (3.32%). Germany, Japan, the UK, France, Russia, Italy & Canada all lost share of GDP. Brazil, 7th-ranked in 2010, fell out of the top-10 altogether by 2025. Canada joins the Top-10, despite Canada's own share also shrinking.
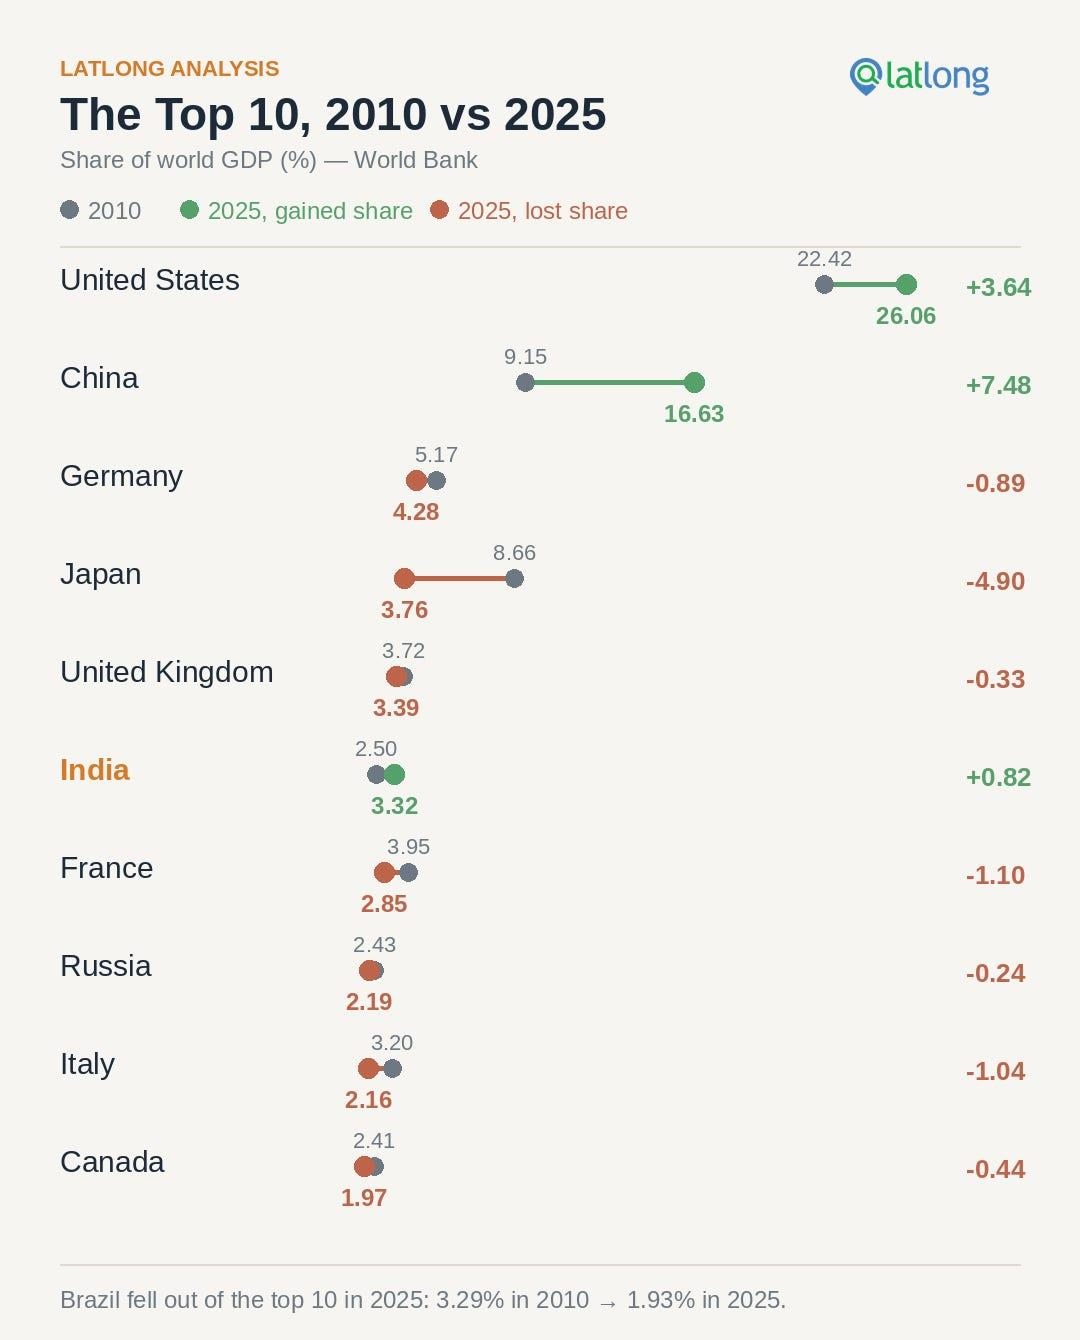
India's 0.82 gain is modest beside China's 7.48 and the United States' 3.64. However, measured against every other economy, it is the largest gain. These 3 gainers are followed by Saudi Arabia (+0.29) and Ireland (+0.28), with a long tail of smaller gainers (Vietnam, Turkey, Bangladesh, Poland, Israel) each under 0.2 points. India's own gain is worth more than half the next seven gainers combined (1.47 points). One way to read "India's rise" is, not as a challenge to China or the US, but as easily the single most significant gain among the roughly 180 economies that aren't China or the United States. India's gain is even more remarkable when considering the depreciation of the currency against the US dollar, which is discussed in greater detail below.
The Losers Are A Reminder That "Rising" Is Relative
Japan's fall (-4.90 points) is the single largest move, in either direction, outside China and the US. This is a bigger absolute swing than India's gain. Brazil (-1.36), France (-1.09), Italy (-1.04) and Germany (-0.89) round out the top five losers. Iran, Nigeria, Spain, Canada & Venezuela complete the list, each down by less than 0.6 points. Canada's smaller fall paradoxically brought it a top-10 seat, because Brazil fell further still — a move up, due to someone else's larger fall.
The Weak Yen And The Weaker Rupee
This article deals with GDP as measured in US dollars. So, a country's exchange rate against the dollar is baked into the number, alongside its real economic performance. Japan is a good illustration: the Japanese Yen (JPY) weakened from ¥87.8 to the dollar in 2010 to ¥151.4 in 2024, a depreciation of roughly 72% (World Bank data). A good deal of Japan's GDP share decline is explained by the yen simply buying fewer dollars than it used to, not Japan producing less.
The same effect, in varying strength, sits behind several of the other big falls. Brazil's Real (-206%) & Russia's Rouble (-205%) depreciated even more sharply than the yen. Nigeria's naira collapsed by ~880%, the sharpest currency move in this dataset. The euro slid a comparatively modest ~22% against the dollar — a smaller, shared drag behind the declines of France, Germany, Italy and Spain. Canada's dollar weakened by ~33%. One isn't arguing that these economies didn't lose ground, as a weaker currency raises import costs and squeezes real living standards; but a meaningful share of the "fall" in each case is the USD exchange rate.
In this backdrop, it is worth looking at the Indian Rupee against the USD. The rupee weakened from about ₹45.7 to the dollar in 2010 to ₹83.7 in 2024: a depreciation of roughly 83%, sharper than the yen's. Despite this sharp fall, India's GDP share rose. Where Japan lost share partly because of currency weakness, India gained share despite greater currency weakness. Not only did the Indian economy grow in these 15 years, the growth was large enough to swim against a currency depreciation current, pulling the dollar-denominated number down.
The Bottom Line
Between 2010 & 2025, India's share of world GDP rose by 0.82 percentage points — the third-largest gain of any country. That gain happened despite the rupee losing more value against the dollar over the period than the yen did. This gain moved India from 9th to 6th among the world's largest economies. This move happened in a world where the top-10 economies, as a group, grew their combined share from 64.5% to 66.6%. Several of the biggest declines in GDP share, Japan's chief among them, owe a great deal to currency depreciation against the dollar. India's growth and move up the GDP charts is made more impressive by the currency headwind it faced getting there.
This article was first published by the author on Substack: https://pnbhatta.substack.com/p/growth-of-indias-share-of-global.
More posts

Sep 18, 2026
The Day a New Dealership Broke an Entire Sales Territory

Sep 11, 2026
Schools, Enrolment and Teachers: There Aren't Enough Children
Aug 1, 2026
Bengaluru's Traffic Gridlock: Data Points to an Uncomfortable Truth

Jul 27, 2026
Hyperlocal Location Identification: Why the 'Periphery' is the New Frontier for Business
Put location to work.
See how latlong.ai products fit your team. Book a 30-minute walkthrough with our solutions team.