

Bigger Isn't Always Better: Telangana's Next MSME Lending Hotspots

Why Telangana's biggest districts aren't the best MSME lending markets. How location intelligence and UPI data reveal emerging credit hotspots first.
"Where money moves first, credit demand often follows."
Growth doesn't happen where everyone is looking. Growth happens where signals converge before the market notices. The playbook is usually familiar: identify districts with the largest business populations, open branches, deploy sales teams, and compete aggressively for market share. On paper, this approach appears logical. Larger markets should mean larger opportunities.
Except they don't.
When we recently evaluated expansion opportunities for a financial institution looking to strengthen its MSME lending presence in Telangana, one observation became clear very early in the analysis: the districts attracting the most attention were often the same districts attracting the most competition.
The challenge was not finding places with economic activity. Telangana has plenty of those.
The challenge was identifying places where economic growth, business activity, digital adoption and competitive whitespace were converging simultaneously.
In other words, where would a lender have the highest probability of building a profitable portfolio before everybody else arrived?
To answer that question, we built a multi-layered location intelligence framework combining MSME density, competitor presence, district GDP growth, per-capita income growth and UPI transaction trends across the state.
What we discovered fundamentally changed the expansion narrative. At first glance, the obvious candidates looked exactly as expected. The districts surrounding Hyderabad dominated most economic indicators. They accounted for some of the largest MSME populations, significant credit activity and substantial transaction volumes.
However, once we layered competitive intensity into the AI model, the picture became considerably more nuanced.
A district with a massive MSME base can still be a poor expansion choice if every major lender is already competing for the same businesses. The objective was therefore not to identify where MSMEs already existed. It was to identify where MSMEs were emerging faster than the lending ecosystem itself.
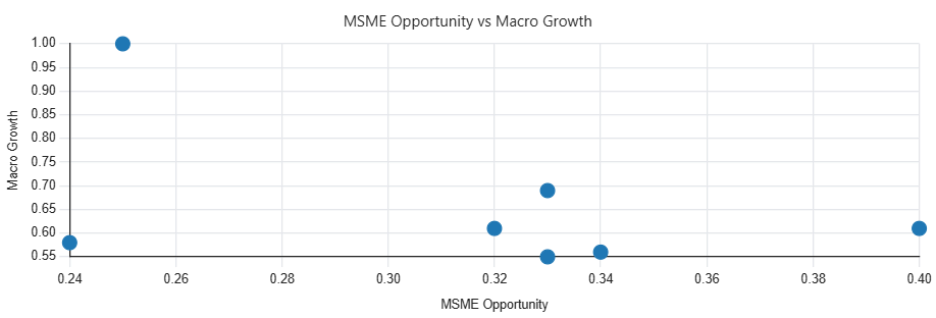
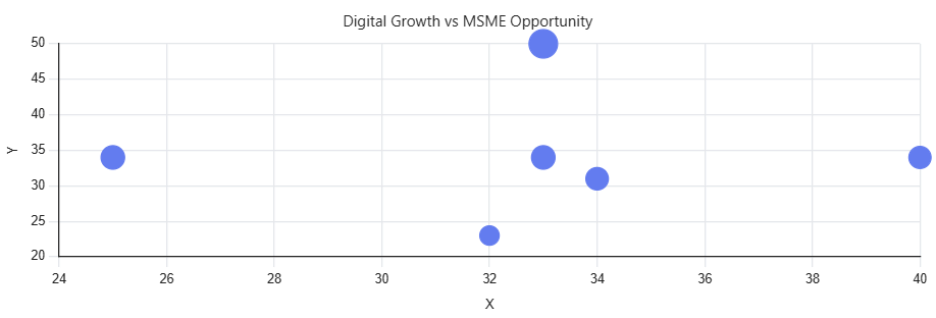
To do this, districts were scored across two dimensions: opportunity and momentum. Opportunity measured the size of the addressable MSME market adjusted for competitive intensity, while momentum incorporated district-level GDP growth and increases in per-capita income.
The resulting quadrant analysis immediately surfaced a set of districts that were far more attractive than their absolute size would suggest.
A Small District Kept Appearing at the Top
One district repeatedly surfaced across multiple datasets. Not because it was among the largest. Not because it generated the highest business volumes. But because nearly every leading indicator pointed in the same direction.
GDP growth was strong. Income growth was strong. Digital payments were accelerating. Competition remained relatively limited.
When all indicators were combined into a composite ranking framework, this emerging district outranked several larger and more established markets.
For the client, this was one of the most important discoveries of the project. Traditional market selection approaches would likely have overlooked it entirely.
Following the Money Through UPI
One of the most powerful signals came from a source that is still underutilised in lending strategy: digital payments. Historically, lenders have relied on business registrations, census data, branch performance or economic surveys when evaluating market potential. While useful, these indicators are often retrospective. UPI data behaves differently.
It provides a near real-time view of economic activity.
As transaction values and volumes were incorporated into the model, several emerging districts displayed a pattern that was difficult to ignore. Markets with moderate MSME density were demonstrating extraordinary growth in digital transactions, indicating increasing formalisation and commercial activity. In some cases, UPI trends reinforced our confidence in districts that initially seemed too small to prioritise.
What looked insignificant through a traditional lens suddenly appeared highly attractive when digital payment behaviour was factored in.
"Before businesses appear in lending portfolios, they often appear in digital transaction networks."
The Most Interesting Discovery Happened at the Pincode Level
District analysis proved valuable, but the real story emerged when we zoomed in further.
Most expansion strategies treat districts as homogeneous markets. They're not.
When MSME registrations were mapped at pincode level, a striking long-tail pattern emerged. A substantial percentage of pincodes contained only a handful of MSMEs, while a relatively small number of micro-markets accounted for thousands of businesses.
In one cluster, a handful of pincodes emerged as economic engines, each containing several thousand MSMEs and a highly diverse commercial ecosystem.
Even more interesting was the consistency of economic activity across these hubs. Rather than a single dominant sector, these locations displayed the diversity typically associated with resilient local economies.
Expansion Is a Geography Problem, Not a Branch Problem
Once priority markets had been identified, the next challenge was operational.
How do you serve multiple high-growth markets without building an unnecessarily large branch network?
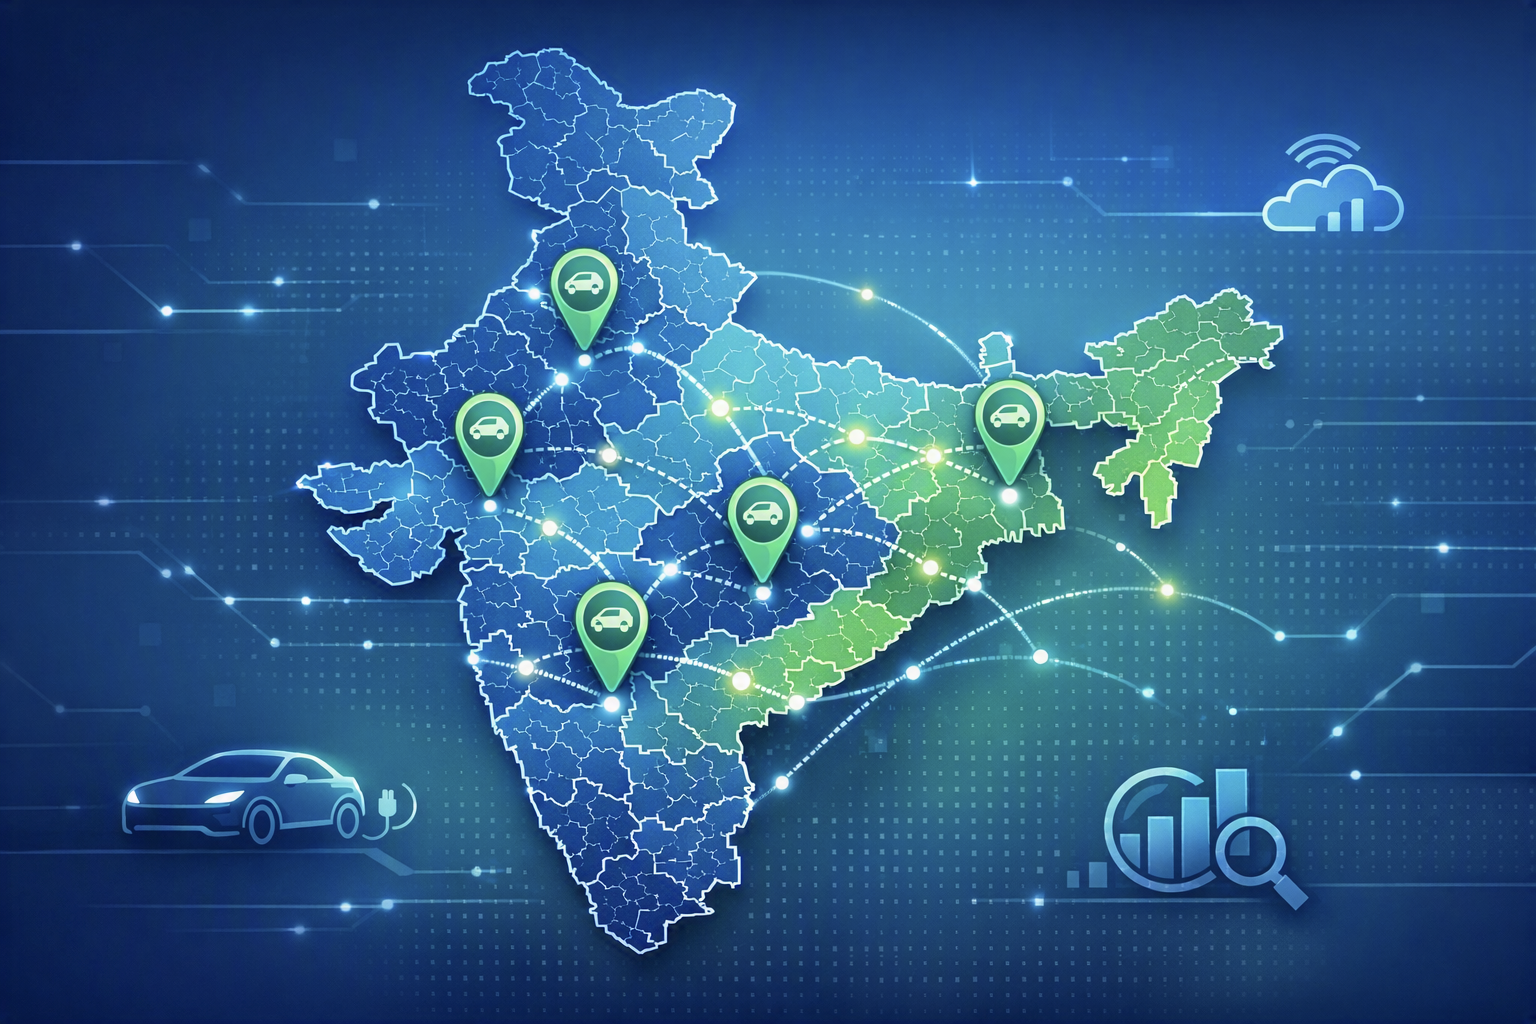
Instead of treating every district independently, we analysed road connectivity, geographic adjacency and operational catchments to identify clusters that could be serviced from strategically located anchors.
The outcome was a network design that balanced opportunity with efficiency. Rather than opening multiple standalone branches, the institution could establish a smaller number of anchor locations supported by satellite coverage across neighbouring markets.
The Real Lesson
The most valuable insight from this project was not which districts ranked first or second. It was the realization that market size alone is a poor predictor of lending opportunity.
The strongest lending markets often sit at the intersection of four forces:
- Meaningful business density
- Accelerating economic growth
- Increasing digital transaction adoption
- Manageable competitive intensity
Viewed independently, these signals can appear ordinary. Viewed together, they reveal entirely new growth corridors.
And that's ultimately what location intelligence does best. It helps organisations stop asking, "Where is the biggest market?" and start asking, "Where is the next big market emerging?" Those are rarely the same place.
The future of market expansion belongs to organizations that can see momentum before they can see market size.

Put location to work.
See how latlong.ai products fit your team. Book a 30-minute walkthrough with our solutions team.